
Introduction
Understanding the relationship between probability and z-scores is an essential part of statistics. Whether you are studying for an exam, analyzing research data, or working with normally distributed measurements, converting an area under the normal distribution curve into a z-score can help you interpret your results accurately.
An Area to Z Score Calculator helps you find the z-score that corresponds to a specified probability or area under the standard normal distribution curve. Instead of searching through statistical tables or performing complicated calculations manually, you can enter a probability and quickly determine the corresponding z-score.
For example, you might want to find the z-score associated with the 90th percentile of a normally distributed dataset. An area-to-z-score conversion makes this calculation straightforward.
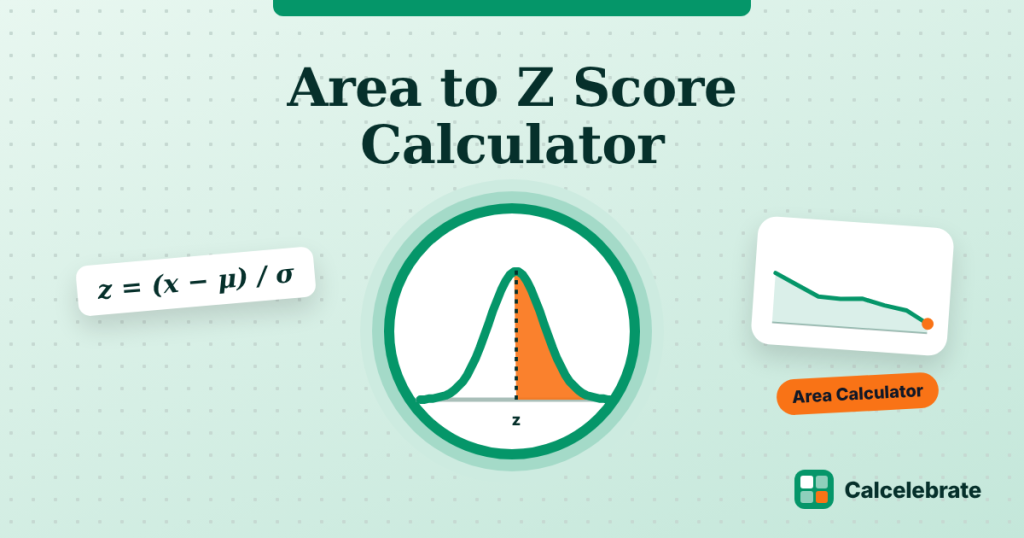
In this guide, you will learn how the calculator works, which formulas are used, how to interpret different types of area, and how to solve practical statistical problems.
What Is an Area to Z Score Calculator?
An Area to Z Score Calculator is a statistical tool that converts a probability or area under a normal distribution curve into its corresponding z-score.
A z-score describes how far a particular value lies from the mean of a distribution, measured in standard deviations.
The standard normal distribution has two important characteristics:
- Its mean is equal to \(0\).
- Its standard deviation is equal to \(1\).
The total area beneath the normal distribution curve is \(1\), representing 100% probability.
When you know the area associated with a particular region of the curve, you can use an inverse normal distribution calculation to find the z-score marking the boundary of that region.
For example, a cumulative area of \(0.95\) corresponds to a z-score of approximately \(1.645\). This means that about 95% of the standard normal distribution lies to the left of that z-score.
The calculator is particularly useful for students, teachers, researchers, analysts, and anyone who needs to convert statistical probabilities into standardized scores.
What Is a Z-Score?
A z-score, also called a standard score, expresses the position of an observation relative to the mean of a distribution.
The formula for calculating a z-score from an observed value is:
\[z=\frac{x-\mu}{\sigma}\]
Where:
- \(z\) = z-score
- \(x\) = observed value
- \(\mu\) = population mean
- \(\sigma\) = population standard deviation
A positive z-score indicates that the value is above the mean, while a negative z-score indicates that it is below the mean.
A z-score of zero means the observation is exactly equal to the mean.
However, an Area to Z Score Calculator works in the opposite direction. Instead of calculating a z-score from an observed value, it finds the z-score corresponding to a known probability.
This reverse calculation is useful when you know the percentage or probability you want to locate on the normal distribution curve.
How Does an Area to Z Score Calculator Work?
The calculator uses the standard normal distribution to convert a specified area into a z-score.
The exact process depends on whether the input represents the area to the left, the area to the right, or the area between two z-scores.
1. Enter the Known Area
First, identify the probability or area you want to convert.
For example, an area of \(0.80\) represents 80% of the total distribution.
If your input is a percentage, convert it into a decimal before using a calculator that requires probability values.
For example:
\[80\%=\frac{80}{100}=0.80\]
2. Identify the Type of Area
Determine which region of the normal curve the given area represents.
Common options include:
- Left-tail area: The proportion of observations below a particular z-score.
- Right-tail area: The proportion of observations above a particular z-score.
- Area between two values: The probability that a normally distributed observation falls between two z-scores.
Choosing the correct area type is important because the same numerical probability can produce different z-scores depending on how the region is defined.
3. Calculate the Corresponding Z-Score
The calculator applies the inverse standard normal distribution function to determine the z-score.
For a left-tail probability \(p\), the calculation is:
\[z=\Phi^{-1}(p)\]
Here, \(\Phi^{-1}\) is the inverse cumulative distribution function of the standard normal distribution.
For example, when the left-tail area is \(0.80\), the corresponding z-score is approximately:
\[z\approx0.842\]
The result tells you that approximately 80% of the distribution lies below this point.
Formula for Converting Area to Z-Score
The cumulative distribution function of the standard normal distribution is written as:
\[\Phi(z)=P(Z\leq z)\]
It represents the probability that a standard normal random variable \(Z\) is less than or equal to a specified z-score.
To convert a known left-tail area into a z-score, use:
\[\boxed{z=\Phi^{-1}(p)}\]
Where \(p\) is the cumulative probability to the left of the required z-score.
For a right-tail probability \(r\), the corresponding left-tail probability is \(1-r\). Therefore:
\[\boxed{z=\Phi^{-1}(1-r)}\]
These formulas are the mathematical foundation of an Area to Z Score Calculator.
The inverse function is generally evaluated using numerical algorithms or statistical software rather than by ordinary algebraic rearrangement.
Understanding Left-Tail, Right-Tail, and Middle Areas
Before entering a probability, it is important to understand the three most common area types.
Left-Tail Area
The left-tail area represents the probability that a value is less than a particular z-score.
It is expressed as:
\[P(Z\leq z)=p\]
Suppose you need the z-score corresponding to a cumulative probability of \(0.90\).
Using the inverse standard normal distribution:
\[z=\Phi^{-1}(0.90)\]
The result is approximately:
\[z\approx1.282\]
This means that 90% of observations lie below this z-score.
Right-Tail Area
The right-tail area represents the probability that a value is greater than a particular z-score.
It is expressed as:
\[P(Z>z)=r\]
Because the total area under the curve is \(1\), the left-tail probability is:
\[p=1-r\]
For a right-tail area of \(0.05\):
\[p=1-0.05=0.95\]
Therefore:
\[z=\Phi^{-1}(0.95)\approx1.645\]
The corresponding z-score is approximately \(1.645\).
Area Between Two Z-Scores
Sometimes you know the probability between two boundaries rather than the area on one side.
For two z-scores \(z_1\) and \(z_2\), where \(z_1<z_2\), the area between them is:
\[P(z_1<Z<z_2)=\Phi(z_2)-\Phi(z_1)\]
If the area is centered around zero, symmetry can simplify the calculation.
For example, approximately 95% of the standard normal distribution lies between:
\[z_1=-1.96\]
and
\[z_2=1.96\]
This interval is frequently used when constructing two-sided 95% confidence intervals under standard normal assumptions.
Area to Z Score Examples
The following examples illustrate how probabilities correspond to z-scores.
Example 1: Find the Z-Score for a Left Area of 0.75
Suppose the cumulative area to the left is \(0.75\).
Step 1: Identify the probability.
\[p=0.75\]
Step 2: Apply the inverse normal distribution.
\[z=\Phi^{-1}(0.75)\]
Step 3: Calculate the result.
\[\boxed{z\approx0.674}\]
The z-score is approximately \(0.674\), meaning 75% of the distribution lies below this point.
Example 2: Find the Z-Score for a Right Area of 0.10
Suppose the right-tail area is \(0.10\).
Step 1: Convert the right-tail area into a left-tail probability.
\[p=1-0.10=0.90\]
Step 2: Calculate the z-score.
\[z=\Phi^{-1}(0.90)\]
Therefore:
\[\boxed{z\approx1.282}\]
Approximately 10% of the distribution lies above this z-score.
Example 3: Find the Z-Score for a Left Area of 0.025
Suppose you need the z-score corresponding to a cumulative probability of \(0.025\).
Using the inverse normal distribution:
\[z=\Phi^{-1}(0.025)\]
The result is approximately:
\[\boxed{z\approx-1.960}\]
This is a commonly used critical value for the lower tail of a two-sided 95% confidence interval.
Example 4: Find the Z-Score for the 95th Percentile
The 95th percentile means that 95% of the distribution lies below the specified point.
Convert the percentile into a probability:
\[p=\frac{95}{100}=0.95\]
Then calculate:
\[z=\Phi^{-1}(0.95)\]
The result is:
\[\boxed{z\approx1.645}\]
This z-score marks the boundary above which approximately 5% of observations remain.
Common Area-to-Z-Score Reference Table
The following table provides approximate z-scores for frequently used left-tail probabilities.
| Left-tail area | Percentage | Approximate z-score |
|---|---|---|
| 0.0100 | 1% | -2.326 |
| 0.0250 | 2.5% | -1.960 |
| 0.0500 | 5% | -1.645 |
| 0.1000 | 10% | -1.282 |
| 0.2500 | 25% | -0.674 |
| 0.5000 | 50% | 0.000 |
| 0.7500 | 75% | 0.674 |
| 0.9000 | 90% | 1.282 |
| 0.9500 | 95% | 1.645 |
| 0.9750 | 97.5% | 1.960 |
| 0.9900 | 99% | 2.326 |
| 0.9950 | 99.5% | 2.576 |
| 0.9990 | 99.9% | 3.090 |
These values are rounded. Minor differences may occur depending on the numerical precision used by a calculator or statistical program.
Remember that this table shows left-tail areas. If you are working with right-tail probabilities, convert them to left-tail probabilities before looking up the z-score.
Practical Applications of Area to Z Score Conversion
Converting probability areas into z-scores has several practical uses in statistics and data analysis.
Hypothesis Testing
Researchers use z-scores to identify critical values for statistical tests. These values help determine whether observed results fall within or outside an expected probability range.
Confidence Intervals
Z-scores are used to calculate confidence intervals for population parameters when the relevant normal approximation and statistical assumptions are appropriate.
For example, the critical z-value for a two-sided 95% confidence level is approximately \(1.96\).
Percentile Ranking
An area-to-z-score conversion helps identify the standardized position associated with a percentile.
This can be useful in educational testing, performance analysis, and research involving normally distributed measurements.
Quality Control
Manufacturers may use standardized scores to evaluate production measurements and identify observations that are unusually far from a target mean.
Research and Data Analysis
Students and researchers can use z-scores to interpret probability distributions, compare standardized measurements, and understand statistical significance.
In every case, the result should be interpreted in the context of the distribution and assumptions underlying the analysis.
Common Mistakes to Avoid
When using an Area to Z Score Calculator, watch out for these common errors:
- Confusing left-tail and right-tail areas: A right-tail probability must be converted into its corresponding left-tail probability when using the inverse cumulative distribution function.
- Entering a percentage incorrectly: Enter \(0.95\) rather than \(95\) when the calculator expects a probability between zero and one.
- Ignoring negative z-scores: Probabilities below \(0.50\) correspond to negative z-scores in the standard normal distribution.
- Confusing area with z-score: An area is a probability, while a z-score represents a standardized position on the horizontal axis.
- Assuming every dataset is normally distributed: The standard normal conversion is appropriate for normal-distribution probabilities. Other distributions may require different methods.
- Rounding too early: Keep sufficient precision during calculations and round the final result according to your requirements.
Avoiding these mistakes will help you obtain more reliable and meaningful statistical results.
Frequently Asked Questions
1. What is an Area to Z Score Calculator?
An Area to Z Score Calculator is a statistical tool that converts a specified probability under the standard normal distribution into its corresponding z-score. It is commonly used to find critical values, percentile positions, and probability boundaries.
2. How do I convert area to a z-score?
For a left-tail area \(p\), use the inverse standard normal distribution:
\[z=\Phi^{-1}(p)\]
Enter the probability into the calculator and select the appropriate area type. For a right-tail area, first subtract the probability from \(1\).
3. What z-score corresponds to an area of 0.95?
If \(0.95\) represents the area to the left, the corresponding z-score is approximately \(1.645\). This leaves an area of \(0.05\) in the right tail.
4. Can an area-to-z-score conversion produce a negative value?
Yes. A left-tail area below \(0.50\) corresponds to a negative z-score. For example, a left-tail area of \(0.025\) corresponds to approximately \(-1.960\).
5. What is the difference between an area-to-z-score calculator and a z-score calculator?
An area-to-z-score calculator starts with a probability and finds the corresponding standardized score. A conventional z-score calculator typically starts with an observation, mean, and standard deviation and calculates how many standard deviations the observation lies from the mean.
Conclusion
An Area to Z Score Calculator makes it easier to convert probabilities into standardized values under the normal distribution. By understanding cumulative areas, tail probabilities, inverse normal functions, and the meaning of positive and negative z-scores, you can solve a wide range of statistical problems with greater confidence.
Whether you are preparing for an examination, conducting research, performing hypothesis tests, or analyzing percentiles, understanding the relationship between area and z-score is a valuable statistical skill.
Ready to simplify your statistical calculations? Use our Area to Z Score Calculator to convert your known probability into a z-score quickly and accurately. Enter your area, choose the correct tail option, and get the result you need for your next statistics problem.