The Area Under a Curve is a fundamental concept in calculus, representing the integral of a function f(x) between two points, usually denoted as a (lower limit) and b (upper limit). Geometrically, it is the region bounded by the function graph, the x-axis, and the vertical lines x = a and x = b.
Mathematically, this is expressed as the definite integral:
Area = ∫[a to b] f(x) dx
This calculator allows you to find this area using various numerical integration methods, providing high-precision results for both continuous functions and discrete data points.
Calculator Features
Our Area Under Curve Calculator is designed with advanced features to cater to students, engineers, and researchers. Here is what makes it a “Gold Standard” tool:
1. Dual Calculation Modes
The tool supports two distinct modes:Using Function: Enter any mathematical expression defined as f(x) (e.g., x^2 + sin(x)).
Using Data Points: Paste your experimental data (x, y) coordinates to find the integral of discrete datasets.
2. Multiple Integration Algorithms
Choose the method that fits your accuracy needs:
Adaptive Simpson’s Rule: best for high precision with automatic error control.
Trapezoidal Rule: standard method using linear approximation.
Simpson’s 1/3 Rule: uses quadratic approximation for better accuracy than trapezoidal.
Riemann Sums: Left, Right, and Midpoint rules for educational purposes and estimation.
3. Area Between Two Curves
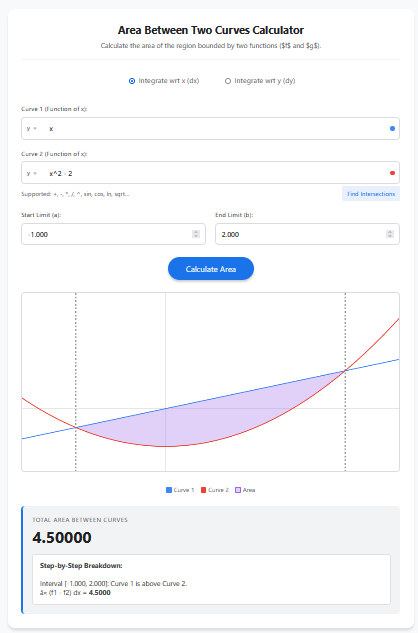
By enabling the “Calculate Area Between Two Curves” option, you can define a second function g(x). The calculator will automatically compute the integral of the difference (f(x) – g(x)), giving you the enclosed area between them.
4. Dynamic Visualization
The interactive graph plots your function(s) and shades the calculated area. You can even drag the vertical limit lines directly on the chart to adjust the integration bounds intuitively.
5. Total Geometric Area
Standard integration yields “Net Area” (where area below the x-axis is negative). This tool includes a “Total Geometric Area” toggle, which treats all regions as positive—useful for calculating total physical displacement or surface area.
Uses and Applications
Physics and Kinematics
In physics, the area under a graph often has significant physical meaning. For example:
Velocity vs. Time graph: Area represents total displacement.
Force vs. Distance graph: Area represents the Work done.
Probability & Statistics
For a continuous random variable, the area under the Probability Density Function (PDF) curve corresponds to the probability of the variable falling within a specific range. For instance, finding the area under the standard normal distribution curve gives the probability Z-score.
Economics (Consumer & Producer Surplus)
Economists use the area between the supply and demand curves to calculate economic surplus. The area below the demand curve and above the market price line represents Consumer Surplus.
Engineering & Medicine
From calculating the total cardiac output from a dye-dilution curve to averaging signal power in electrical engineering, numerical integration of data points is crucial.
Tips for Accurate Calculation
Increase Sub-intervals (n)
When using fixed-step methods like Trapezoidal or Riemann sums, increasing the number of sub-intervals (n) generally reduces the error, making the approximation closer to the true exact integral.
Watch for discontinuities
Ensure your function is defined and continuous over the range [a, b]. If there is a vertical asymptote in the interval, the integral might diverge or require special handling.
Use Adaptive Simpson for Smooth Functions
If your function is smooth (continuous derivatives), the “Adaptive Simpson” method is far superior to Riemann sums. It recursively adjusts the step size to minimize error, giving you the correct answer faster.
Frequently Asked Questions (FAQs)
1. What is the difference between Net Area and Total Area?
The integral calculates “Net Area,” meaning regions below the x-axis count as negative. “Total Area” (or geometric area) treats all regions as positive quantities. Use the checkbox in the calculator to switch between these modes.
2. How do I find the area between two curves?
Simply check the box for “Calculate Area Between Two Curves”. A second input for g(x) will appear. The calculator then evaluates ∫[f(x) – g(x)] dx.
3. Can I calculate the area using only data points?
Yes. Switch to the “Using Data Points” tab. You can paste x,y values (e.g., from Excel), and the tool will use the Trapezoidal rule to estimate the area under the data plot.
4. Which method is most accurate?
For most continuous functions, the Adaptive Simpson method is the most accurate. For discrete data, the Trapezoidal rule is standard, though Simpson’s rule can be used if data points are evenly spaced.
5. Why is the area negative?
If the curve lies below the x-axis for the chosen interval, the definite integral will be negative. This is mathematically correct. If you need the physical size of the area, calculate the absolute value (or use the Total Area option).
Final Words
The Area Under Curve Calculator is a versatile tool bridging the gap between theoretical calculus and real-world application. Whether you are solving a math homework problem, analyzing lab data, or calculating economic surplus, this tool provides the precision and flexibility you need. Remember to choose the appropriate integration method for your specific data type to ensure the highest accuracy.